GSoC 2019 Final Report
This report summarizes the work that I have done during Google Summer of Code 2019.
Contact Information:
Name: Ravindra Kumar Meena
IRC nickname: rmeena840
Email: rmeena840@gmail.com
GitHub handle: rmeena840
Project details:
Project title: Basic Support for Trace Compass (ticket: #3696)
Proposal link: Here
Weekly Updates: Here
GSoC blog: Blog link
Mentors:
* Sebastian Huber
* Gedare Bloom
* Chris Johns
Project Abstract:
The goal of this project is to enable the Trace Compass to analyze and display some basic information using Event Recording infrastructure. Trace Compass is a software for viewing and analyzing any type of logs or traces. The basic information to analyze and display information include CPU usage, IRQ analysis(IRQ Statistics, IRQ Table, IRQ vs Count, IRQ vs Time), Linux Kernel (Control Flow, Resources) etc. Linux Kernel trace graph view in Trace Compass depends on the sched_switch event of LTTng metadata which is used with RTEMS target trace to view the trace graph.
RTEMS wiki of GSoC project: wiki
Development branch on GitHub: rtems-tools, rtems-docs
The above branches on GitHub are the progress of the GSoC project from phase 1 to phase 3.
GSoC project main Objective:
There are three main objectives of the project:
1.) Store the event streams per CPU received from RTEMS target on the host’s disk.
2.) Write the LTTng metadata for the event stream per CPU stored on the host’s disk.
3.) Add the sched_switch event in both LTTng metadata and rtems-record-lttng tool so that Trace Compass can display both CPU Usage and resources graph.
GSoC project previous state:
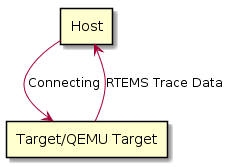
On successfully getting host connected to the target. The target produces the TCP streams to the host which is not in LTTng format.
GSoC project current state:
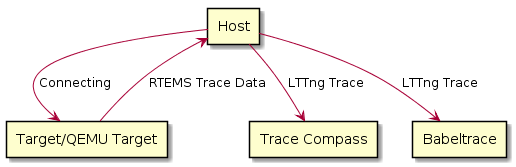
On successfully getting host connected to the target. The target produces the TCP streams to the host which is converted into LTTng format on the host’s side. The Trace Compass and babeltrace are two software that can read the LTTng trace. The babeltrace can only print the LTTng trace whereas, Trace Compass can display CPU usage and resources.
What was done in three GSoC phases:
The GSoC project was divided into three phases.
During GSoC Phase 1:
1.) Write record items generated from RTEMS target on the host’s disk.
2.) Write metadata compatible with generated event streams from the RTEMS target.
Main Outcome of Phase 1: The babeltrace can read and print the event streams generated from RTEMS target.
During GSoC Phase 2:
1.) Modified the rtems-record-lttng tool program to read from a file if a –input= command-line option is given so that the rtems-record-lttng tool program can read from a given file input.
2.) Produced LTTng metadata. In these LTTng components like packet.header, packet.context etc were added.
3.) Modified rtems-record-lttng tool program to produce trace from RTEMS target which is compatible with LTTng metadata.
4.) Added LTTng sched_switch event in both rtems-record-lttng tool and LTTng metadata. This event helps in visualization of CPU usage and resources in the Trace Compass.
Main Outcome of Phase 2: The rtems-record-lttng tool program now has support to read from a file if –input= command-line option is given. Earlier only babeltrace was able to read the event stream but now Trace Compass can also read event stream values. The Trace Compass can also display the CPU Usage and resources.
During GSoC Phase 3:
1.) Stored thread id and thread name in a table so that the table can be used later in the LTTng sched_switch event. This table helps in retrieving the name of thread.
2.) Populated the thread id and thread name table to LTTng sched_switch event in the rtems-record-lttng tool so that threads can have the name.
3.) Thread state (IDLE/RUNNING) support for thread was added. This helps in figuring out the state (IDLE/RUNNING) of thread.
4.) Generated metadata from the rtems-record-lttng tool.
Main Outcome of Phase 3: The Trace Compass can now display the thread state (IDLE/RUNNING) and thread names. The rtems-record-lttng tool program can now generate LTTng metadata.
Trace Compass trace visualization snapshot:
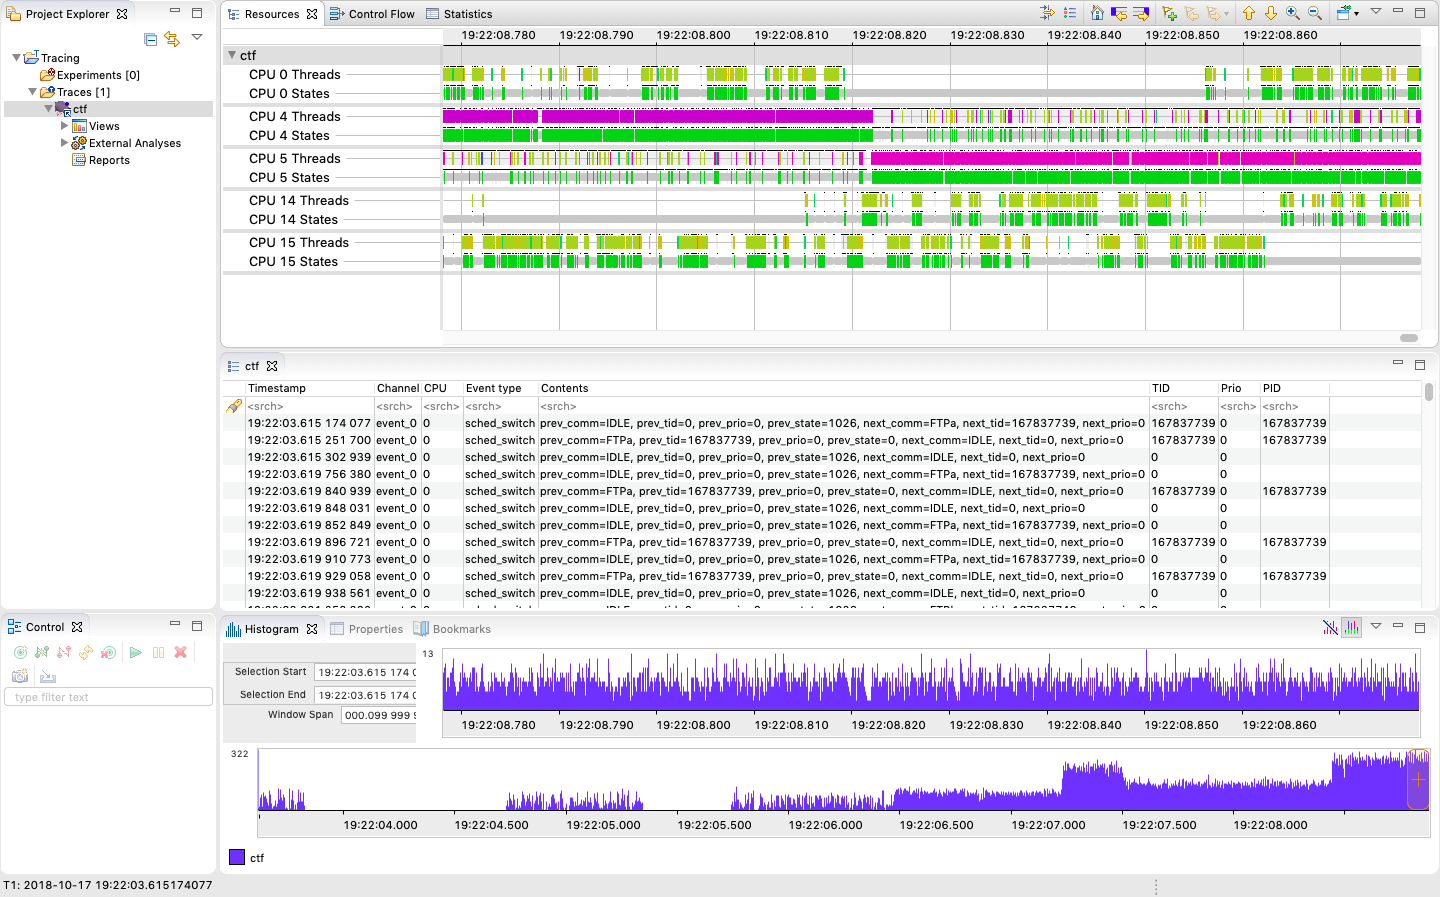
The above Trace Compass visualization is generated from raw data available at: raw-data
It is an event record stream with 24 CPUs so that the user can test the event stream file per CPU. It was tested on Linux Fedora 30.
The above snapshot shows the CPU usage and resource graph with thread names.
Code contribution:
LTTng sched_switch support patch
The above patch is for LTTng sched_switch support. This single patch comprises the work done in phase 1/2/3. The patch got merged!
Documentation contribution:
LTTng sched_switch support documentation patch
The above patch is for rtems-docs event recording section. This contains the example and steps to convert the trace from RTEMS target into LTTng format.
What is left – Bugs and Further Enhancements
* The output command line feature can be added to the rtems-record-lttng tool program. With this, the traces and metadata can be generated in a particular folder.
* There is no IRQ support yet.
* Advanced support for Trace Compass could include dynamic memory traces, stack usage, network packet flow, etc.
Acknowledgment
So this is it – the end of the official GSoC coding period. Thank you to the Google Summer of Code Team and the RTEMS community for bringing this project to life, and of course huge thanks to my mentors Sebastian Huber, Gedare Bloom and Chris Johns for their feedback and guidance throughout the entire project. I would further like to extend my deep gratitude towards our RTEMS organization admins, Dr. Joel Sherrill, Gedare Bloom and Chris Johns for their valuable inputs and support. Special thanks to LTTng community for their wonderful reviews and generosity.
Altogether, this was a great experience and I will remain an active contributor for the foreseeable future. Happy coding!
Subscribe to my YouTube Channel
How to crack Google Summer of Code?